今天教大家如何在R中做验证性因子分析,R中能做CFA的包不止一个,但lavaan是最常用的SEM包。lavaan是latent variable analysis的组合,从名称中我们就可以看出它是一个关于潜变量分析的工具。
lavaan的相关资料网站有:
lavaan: An R Package for Structural Equation Modeling
install.packages("lavaan")
library(lavaan) # 安装并载入lavaan包
Lavaan包中有个数据集叫HolzingerSwineford1939,本次验证性因子分析的数据就在这个数据集中,以下是关于这个数据集的描述:
The classic Holzinger and Swineford (1939) dataset consists of mental ability test scores of seventh- and eighth-grade children from two different schools (Pasteur and Grant-White). In the original dataset (available in the MBESS package), there are scores for 26 tests. However, a smaller subset with 9 variables is more widely used in the literature (for example in Joreskog’s 1969 paper, which also uses the 145 subjects from the Grant-White school only).
在安装lavaan包后,简要查看下数据集中的数据大致是个什么样子
head(HolzingerSwineford1939)
  id sex ageyr agemo  school grade       x1   x2    x3       x4   x5        x6       x7   x8       x9
1  1   1    13     1 Pasteur     7 3.333333 7.75 0.375 2.333333 5.75 1.2857143 3.391304 5.75 6.361111
2  2   2    13     7 Pasteur     7 5.333333 5.25 2.125 1.666667 3.00 1.2857143 3.782609 6.25 7.916667
3  3   2    13     1 Pasteur     7 4.500000 5.25 1.875 1.000000 1.75 0.4285714 3.260870 3.90 4.416667
4  4   1    13     2 Pasteur     7 5.333333 7.75 3.000 2.666667 4.50 2.4285714 3.000000 5.30 4.861111
5  5   2    12     2 Pasteur     7 4.833333 4.75 0.875 2.666667 4.00 2.5714286 3.695652 6.30 5.916667
6  6   2    14     1 Pasteur     7 5.333333 5.00 2.250 1.000000 3.00 0.8571429 4.347826 6.65 7.500000
查看数据集的结构,数据集中包含15个变量variables,共301个观察值obs,5个整数型变量int,1个因子型变量factor,9个数值型变量num。
str(HolzingerSwineford1939)
'data.frame':	301 obs. of  15 variables:
 $ id    : int  1 2 3 4 5 6 7 8 9 11 ...
 $ sex   : int  1 2 2 1 2 2 1 2 2 2 ...
 $ ageyr : int  13 13 13 13 12 14 12 12 13 12 ...
 $ agemo : int  1 7 1 2 2 1 1 2 0 5 ...
 $ school: Factor w/ 2 levels "Grant-White",..: 2 2 2 2 2 2 2 2 2 2 ...
 $ grade : int  7 7 7 7 7 7 7 7 7 7 ...
 $ x1    : num  3.33 5.33 4.5 5.33 4.83 ...
 $ x2    : num  7.75 5.25 5.25 7.75 4.75 5 6 6.25 5.75 5.25 ...
 $ x3    : num  0.375 2.125 1.875 3 0.875 ...
 $ x4    : num  2.33 1.67 1 2.67 2.67 ...
 $ x5    : num  5.75 3 1.75 4.5 4 3 6 4.25 5.75 5 ...
 $ x6    : num  1.286 1.286 0.429 2.429 2.571 ...
 $ x7    : num  3.39 3.78 3.26 3 3.7 ...
 $ x8    : num  5.75 6.25 3.9 5.3 6.3 6.65 6.2 5.15 4.65 4.55 ...
 $ x9    : num  6.36 7.92 4.42 4.86 5.92 ...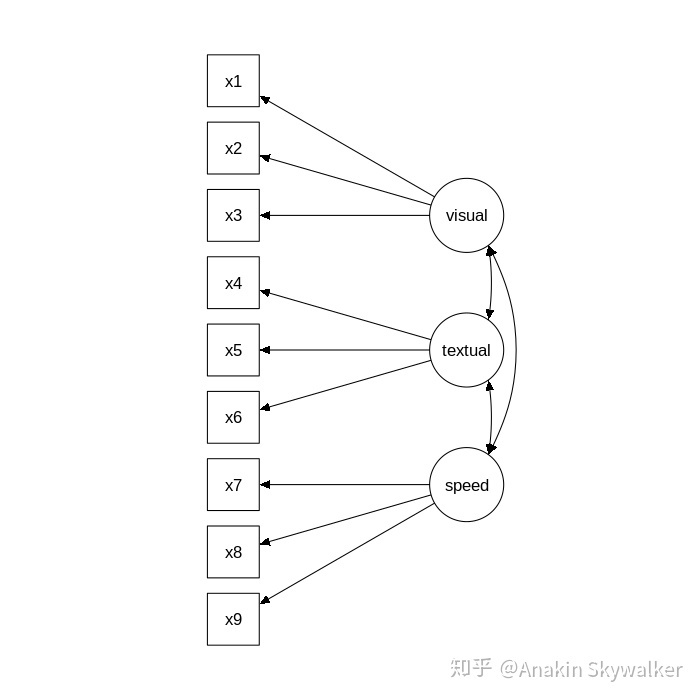

一共3个潜变量,分别为visual, textual, speed
visual包含3个观察变量,x1,x2,x3
textual包含3个观察变量,x4,x5,x6
speed包含3个观察变量,x7,x8,x9
划重点了,=~符号左边是潜变量,右边是指标
latent variable =~ indicator1 + indicator2 + indicator3我们按照上述格式,列出本例中3个潜变量的组成情况
visual =~ x1 + x2 + x3
textual =~ x4 + x5 + x6
speed =~ x7 + x8 + x9
然后组建模型,我们将这个模型命名为HS.model
HS.model <- ' visual  =~ x1 + x2 + x3
              textual =~ x4 + x5 + x6
              speed   =~ x7 + x8 + x9 '
下一步用cfa命令做验证性因子分析,cfa即为验证性因子分析的英文缩写,所用数据为HolzingerSwineford1939,并将cfa的结果赋值给fit
fit <- cfa(HS.model, data=HolzingerSwineford1939)用summary命令查看fit结果,fit.measures = TRUE表示我们需要拟合度指标,默认不给出。
summary(fit, fit.measures=TRUE)
lavaan (0.6-1) converged normally after  35 iterations

  Number of observations                           301

  Estimator                                         ML
  Model Fit Test Statistic                      85.306
  Degrees of freedom                                24
  P-value (Chi-square)                           0.000

Model test baseline model:

  Minimum Function Test Statistic              918.852
  Degrees of freedom                                36
  P-value                                        0.000

User model versus baseline model:

  Comparative Fit Index (CFI)                    0.931
  Tucker-Lewis Index (TLI)                       0.896

Loglikelihood and Information Criteria:

  Loglikelihood user model (H0)              -3737.745
  Loglikelihood unrestricted model (H1)      -3695.092

  Number of free parameters                         21
  Akaike (AIC)                                7517.490
  Bayesian (BIC)                              7595.339
  Sample-size adjusted Bayesian (BIC)         7528.739

Root Mean Square Error of Approximation:

  RMSEA                                          0.092
  90 Percent Confidence Interval          0.071  0.114
  P-value RMSEA <= 0.05                          0.001

Standardized Root Mean Square Residual:

  SRMR                                           0.065

Parameter Estimates:

  Information                                 Expected
  Information saturated (h1) model          Structured
  Standard Errors                             Standard

Latent Variables:
                   Estimate  Std.Err  z-value  P(>|z|)
  visual =~
    x1                1.000
    x2                0.554    0.100    5.554    0.000
    x3                0.729    0.109    6.685    0.000
  textual =~
    x4                1.000
    x5                1.113    0.065   17.014    0.000
    x6                0.926    0.055   16.703    0.000
  speed =~
    x7                1.000
    x8                1.180    0.165    7.152    0.000
    x9                1.082    0.151    7.155    0.000

Covariances:
                   Estimate  Std.Err  z-value  P(>|z|)
  visual ~~
    textual           0.408    0.074    5.552    0.000
    speed             0.262    0.056    4.660    0.000
  textual ~~
    speed             0.173    0.049    3.518    0.000

Variances:
                   Estimate  Std.Err  z-value  P(>|z|)
   .x1                0.549    0.114    4.833    0.000
   .x2                1.134    0.102   11.146    0.000
   .x3                0.844    0.091    9.317    0.000
   .x4                0.371    0.048    7.779    0.000
   .x5                0.446    0.058    7.642    0.000
   .x6                0.356    0.043    8.277    0.000
   .x7                0.799    0.081    9.823    0.000
   .x8                0.488    0.074    6.573    0.000
   .x9                0.566    0.071    8.003    0.000
    visual            0.809    0.145    5.564    0.000
    textual           0.979    0.112    8.737    0.000
    speed             0.384    0.086    4.451    0.000
结果中包含了拟合指标,指标载荷,协方差和方差等信息,但我们注意到题项载荷那一块有超过1的数值,说明这是未标准化的。鉴于文章大多要报告标准化的数据,那么如何才能得到标准化的题项载荷呢?
我们需要在cfa命令中加入http://std.lv = TRUE,然后再查看fit,此时便得到了标准化后的题项载荷。
fit <- cfa(HS.model, data=HolzingerSwineford1939, std.lv=T)
summary(fit, fit.measures=TRUE)

lavaan (0.6-1) converged normally after  22 iterations

  Number of observations                           301

  Estimator                                         ML
  Model Fit Test Statistic                      85.306
  Degrees of freedom                                24
  P-value (Chi-square)                           0.000

Model test baseline model:

  Minimum Function Test Statistic              918.852
  Degrees of freedom                                36
  P-value                                        0.000

User model versus baseline model:

  Comparative Fit Index (CFI)                    0.931
  Tucker-Lewis Index (TLI)                       0.896

Loglikelihood and Information Criteria:

  Loglikelihood user model (H0)              -3737.745
  Loglikelihood unrestricted model (H1)      -3695.092

  Number of free parameters                         21
  Akaike (AIC)                                7517.490
  Bayesian (BIC)                              7595.339
  Sample-size adjusted Bayesian (BIC)         7528.739

Root Mean Square Error of Approximation:

  RMSEA                                          0.092
  90 Percent Confidence Interval          0.071  0.114
  P-value RMSEA <= 0.05                          0.001

Standardized Root Mean Square Residual:

  SRMR                                           0.065

Parameter Estimates:

  Information                                 Expected
  Information saturated (h1) model          Structured
  Standard Errors                             Standard

Latent Variables:
                   Estimate  Std.Err  z-value  P(>|z|)
  visual =~
    x1                0.900    0.081   11.127    0.000
    x2                0.498    0.077    6.429    0.000
    x3                0.656    0.074    8.817    0.000
  textual =~
    x4                0.990    0.057   17.474    0.000
    x5                1.102    0.063   17.576    0.000
    x6                0.917    0.054   17.082    0.000
  speed =~
    x7                0.619    0.070    8.903    0.000
    x8                0.731    0.066   11.090    0.000
    x9                0.670    0.065   10.305    0.000

Covariances:
                   Estimate  Std.Err  z-value  P(>|z|)
  visual ~~
    textual           0.459    0.064    7.189    0.000
    speed             0.471    0.073    6.461    0.000
  textual ~~
    speed             0.283    0.069    4.117    0.000

Variances:
                   Estimate  Std.Err  z-value  P(>|z|)
   .x1                0.549    0.114    4.833    0.000
   .x2                1.134    0.102   11.146    0.000
   .x3                0.844    0.091    9.317    0.000
   .x4                0.371    0.048    7.778    0.000
   .x5                0.446    0.058    7.642    0.000
   .x6                0.356    0.043    8.277    0.000
   .x7                0.799    0.081    9.823    0.000
   .x8                0.488    0.074    6.573    0.000
   .x9                0.566    0.071    8.003    0.000
    visual            1.000
    textual           1.000
    speed             1.000
参考文献:
Yves Rosseel (2012). lavaan: An R Package for Structural Equation Modeling. Journal of Statistical Software, 48(2), 1-36. URL http://www.jstatsoft.org/v48/i02/
本文来自zhihu,观点不代表一起大数据-技术文章心得立场,如若转载,请注明出处:https://zhuanlan.zhihu.com/p/38233209
注意:本文归作者所有,未经作者允许,不得转载

