AVE(Average Variance Extracted)是平均萃取变异量,又叫平均提取方差值,是检验结构变量内部一致性的统计量。
CR(Composite Reliability)是组合信度,是指一个组合变量(composite score,由多于一个变量的总和做成的新变量)的信度。
如果你用过Amos运行SEM,你是无法在报表中找到AVE和CR值的。当然,SPSS也无法得到,而Mplus需要写冗长的语句。能直接在报表中给出AVE和CR值的目前有SmartPLS,其用户界面很友好,操作很容易上手。R中也有一些包可以计算信效度中的cronbach’s alpha以及AVE,CR。由于SmartPLS操作简单,不再介绍,本次教大家用R语言计算AVE和CR值。
semTools
首先需要在Lavaan包中做验证性因子分析,然后使用semTools包对CFA的结果计算我们需要的值,本次使用的数据集是HolzingerSwineford1939,该数据集在Lavaan包中。
library(lavaan) # 载入lavaan,没有安装的用户使用install.packages命令安装看一下数据集的基本情况,
head(HolzingerSwineford1939)

  id sex ageyr agemo  school grade       x1   x2    x3       x4   x5        x6       x7   x8       x9
1  1   1    13     1 Pasteur     7 3.333333 7.75 0.375 2.333333 5.75 1.2857143 3.391304 5.75 6.361111
2  2   2    13     7 Pasteur     7 5.333333 5.25 2.125 1.666667 3.00 1.2857143 3.782609 6.25 7.916667
3  3   2    13     1 Pasteur     7 4.500000 5.25 1.875 1.000000 1.75 0.4285714 3.260870 3.90 4.416667
4  4   1    13     2 Pasteur     7 5.333333 7.75 3.000 2.666667 4.50 2.4285714 3.000000 5.30 4.861111
5  5   2    12     2 Pasteur     7 4.833333 4.75 0.875 2.666667 4.00 2.5714286 3.695652 6.30 5.916667
6  6   2    14     1 Pasteur     7 5.333333 5.00 2.250 1.000000 3.00 0.8571429 4.347826 6.65 7.500000
设置模型
cfamodel <- ' visual =~ x1 + x2 + x3
              textual =~ x4 + x5 + x6
              speed =~ x7 + x8 + x9 '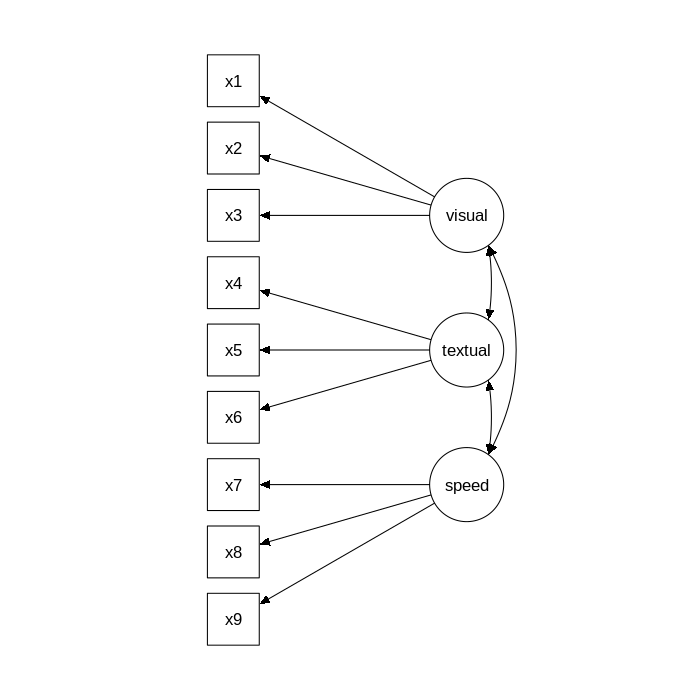

进行CFA
cfafit <- cfa(cfamodel, HolzingerSwineford1939, std.lv = T)note: td.lv和std.all的区别
In the first column (labeled td.lv), only the latent variables are standardized. In the second column (labeled Std.all), both latent and observed variables are standardized. The latter is often called the ‘completely standardized solution‘.
显示CFA的总体结果,需要查看拟合指数
summary(cfafit, fit.measures = T)

lavaan 0.6-2 ended normally after 20 iterations

  Optimization method                           NLMINB
  Number of free parameters                         21

  Number of observations                           301

  Estimator                                         ML
  Model Fit Test Statistic                      85.306
  Degrees of freedom                                24
  P-value (Chi-square)                           0.000

Model test baseline model:

  Minimum Function Test Statistic              918.852
  Degrees of freedom                                36
  P-value                                        0.000

User model versus baseline model:

  Comparative Fit Index (CFI)                    0.931
  Tucker-Lewis Index (TLI)                       0.896

Loglikelihood and Information Criteria:

  Loglikelihood user model (H0)              -3737.745
  Loglikelihood unrestricted model (H1)      -3695.092

  Number of free parameters                         21
  Akaike (AIC)                                7517.490
  Bayesian (BIC)                              7595.339
  Sample-size adjusted Bayesian (BIC)         7528.739

Root Mean Square Error of Approximation:

  RMSEA                                          0.092
  90 Percent Confidence Interval          0.071  0.114
  P-value RMSEA <= 0.05                          0.001

Standardized Root Mean Square Residual:

  SRMR                                           0.065

Parameter Estimates:

  Information                                 Expected
  Information saturated (h1) model          Structured
  Standard Errors                             Standard

Latent Variables:
                   Estimate  Std.Err  z-value  P(>|z|)
  visual =~
    x1                0.900    0.081   11.128    0.000
    x2                0.498    0.077    6.429    0.000
    x3                0.656    0.074    8.817    0.000
  textual =~
    x4                0.990    0.057   17.474    0.000
    x5                1.102    0.063   17.576    0.000
    x6                0.917    0.054   17.082    0.000
  speed =~
    x7                0.619    0.070    8.903    0.000
    x8                0.731    0.066   11.090    0.000
    x9                0.670    0.065   10.305    0.000

Covariances:
                   Estimate  Std.Err  z-value  P(>|z|)
  visual ~~
    textual           0.459    0.064    7.189    0.000
    speed             0.471    0.073    6.461    0.000
  textual ~~
    speed             0.283    0.069    4.117    0.000

Variances:
                   Estimate  Std.Err  z-value  P(>|z|)
   .x1                0.549    0.114    4.833    0.000
   .x2                1.134    0.102   11.146    0.000
   .x3                0.844    0.091    9.317    0.000
   .x4                0.371    0.048    7.779    0.000
   .x5                0.446    0.058    7.642    0.000
   .x6                0.356    0.043    8.277    0.000
   .x7                0.799    0.081    9.823    0.000
   .x8                0.488    0.074    6.573    0.000
   .x9                0.566    0.071    8.003    0.000
    visual            1.000
    textual           1.000
    speed             1.000
显示所有拟合指数,能在文献中找到的拟合指数全都列了出来,这是其他软件做不到的
fitMeasures(cfafit, fit.measures = "all", baseline.model = NULL)

               npar                fmin               chisq                  df              pvalue      baseline.chisq         baseline.df
             21.000               0.142              85.306              24.000               0.000             918.852              36.000
    baseline.pvalue                 cfi                 tli                nnfi                 rfi                 nfi                pnfi
              0.000               0.931               0.896               0.896               0.861               0.907               0.605
                ifi                 rni                logl   unrestricted.logl                 aic                 bic              ntotal
              0.931               0.931           -3737.745           -3695.092            7517.490            7595.339             301.000
               bic2               rmsea      rmsea.ci.lower      rmsea.ci.upper        rmsea.pvalue                 rmr          rmr_nomean
           7528.739               0.092               0.071               0.114               0.001               0.082               0.082
               srmr        srmr_bentler srmr_bentler_nomean         srmr_bollen  srmr_bollen_nomean          srmr_mplus   srmr_mplus_nomean
              0.065               0.065               0.065               0.065               0.065               0.065               0.065
              cn_05               cn_01                 gfi                agfi                pgfi                 mfi                ecvi
            129.490             152.654               0.943               0.894               0.503               0.903               0.423
显示标准化结果
standardizedsolution(cfafit)
       lhs op     rhs est.std    se      z pvalue ci.lower ci.upper
1   visual =~      x1   0.772 0.055 14.041      0    0.664    0.880
2   visual =~      x2   0.424 0.060  7.105      0    0.307    0.540
3   visual =~      x3   0.581 0.055 10.539      0    0.473    0.689
4  textual =~      x4   0.852 0.023 37.776      0    0.807    0.896
5  textual =~      x5   0.855 0.022 38.273      0    0.811    0.899
6  textual =~      x6   0.838 0.023 35.881      0    0.792    0.884
7    speed =~      x7   0.570 0.053 10.714      0    0.465    0.674
8    speed =~      x8   0.723 0.051 14.309      0    0.624    0.822
9    speed =~      x9   0.665 0.051 13.015      0    0.565    0.765
10      x1 ~~      x1   0.404 0.085  4.763      0    0.238    0.571
11      x2 ~~      x2   0.821 0.051 16.246      0    0.722    0.920
12      x3 ~~      x3   0.662 0.064 10.334      0    0.537    0.788
13      x4 ~~      x4   0.275 0.038  7.157      0    0.200    0.350
14      x5 ~~      x5   0.269 0.038  7.037      0    0.194    0.344
15      x6 ~~      x6   0.298 0.039  7.606      0    0.221    0.374
16      x7 ~~      x7   0.676 0.061 11.159      0    0.557    0.794
17      x8 ~~      x8   0.477 0.073  6.531      0    0.334    0.620
18      x9 ~~      x9   0.558 0.068  8.208      0    0.425    0.691
19  visual ~~  visual   1.000 0.000     NA     NA    1.000    1.000
20 textual ~~ textual   1.000 0.000     NA     NA    1.000    1.000
21   speed ~~   speed   1.000 0.000     NA     NA    1.000    1.000
22  visual ~~ textual   0.459 0.064  7.189      0    0.334    0.584
23  visual ~~   speed   0.471 0.073  6.461      0    0.328    0.613
24 textual ~~   speed   0.283 0.069  4.117      0    0.148    0.418
调用semTools包
library(semTools)

###############################################################################
This is semTools 0.5-0
All users of R (or SEM) are invited to submit functions or ideas for functions.
###############################################################################计算AVE,CR等,结果中omega为CR,avevar为AVE,alpha为cronbach’s alpha
reliability(cfafit)
          visual   textual     speed     total
alpha  0.6261171 0.8827069 0.6884550 0.7604886
omega  0.6253185 0.8851756 0.6877607 0.8453355
omega2 0.6253185 0.8851756 0.6877607 0.8453355
omega3 0.6120058 0.8850625 0.6858435 0.8596225
avevar 0.3705594 0.7210168 0.4244891 0.5145880
matrixpls
这个包是关于偏最小二乘法的,内部算法和一般的CB-SEM不一样,所以得出的结果也会不同。
来看下关于matrixpls包的基本介绍:
Estimates a weight matrix using Partial Least Squares or a related algorithm and then uses the weights to estimate the parameters of a statistical model.
matrixpls(S,
          model,
          W.model = NULL,
          weightFun = weightFun.pls,
          parameterEstim = parameterEstim.separate,
          weightSign = NULL, ...,
          validateInput = TRUE,
          standardize = TRUE)
参数介绍:
S
Covariance matrix of the data.
model
There are two options for this argument: 1. lavaan script or lavaan parameter table, or 2. a list containing three matrices inner, reflective, and formative defining the free regression paths in the model.
W.model
An optional numeric matrix representing the weight pattern and starting weights (i.e. the how the indicators are combined to form the composite variables). If this argument is not specified, the weight patter is defined based on the relationships in the reflective and formative elements of model.
weightFun
A function for calculating indicator weights using the data covariance matrix S, a model specification model, and a weight pattern W.model. Returns a weigth matrix W. The default is weightFun.pls
parameterEstim
A function for estimating the model parameters using the data covariance matrix S, model specification model, and weight matrix W. Returns a named vector of parameter estimates. The default is parameterEstim.separate
weightSign
A function for resolving weight sign ambiquity based on the data covariance matrix S and a weight matrix W. Returns a weigth matrix W. See weightSign for details.
...
All other arguments are passed through to weightFun and parameterEstim.
validateInput
If TRUE, the arguments are validated.
standardize
If TRUE, S is converted to a correlation matrix before analysis.
上面参数众多,本次只用到S,model及standardize,其他参数大家有兴趣可以自行研究。
# 载入matrixpls包
library(matrixpls)
# 建立模型,并赋值给cfamodel
cfamodel <- ' visual =~ x1 + x2 + x3
              textual =~ x4 + x5 + x6
              speed =~ x7 + x8 + x9 '
# 我们只用到数据集中的x1-x9,前几行不是数值型数据,没无法计算协方差,所以这里取子集
mydata <- subset(HolzingerSwineford1939, select = c(x1, x2, x3, x4, x5, x6, x7, x8, x9))
# 计算数据的协方差矩阵,并赋值给cov
cov <- cov(mydata)
# 用matrixpls计算模型,并赋值给fit
fit <- matrixpls(cov, cfamodel, standardize = T)
# 查看fit的总体结果
summary(fit)

 matrixpls parameter estimates # 载荷值
                 Est.
visual=~x1  0.7742312
visual=~x2  0.6951567
visual=~x3  0.7996425
textual=~x4 0.9012916
textual=~x5 0.9076744
textual=~x6 0.8956943
speed=~x7   0.7738933
speed=~x8   0.8343229
speed=~x9   0.7475307

 matrixpls weights # weights
               x1        x2       x3        x4        x5        x6        x7       x8        x9
visual  0.4495824 0.4036703 0.464339 0.0000000 0.0000000 0.0000000 0.0000000 0.000000 0.0000000
textual 0.0000000 0.0000000 0.000000 0.3696139 0.3722315 0.3673185 0.0000000 0.000000 0.0000000
speed   0.0000000 0.0000000 0.000000 0.0000000 0.0000000 0.0000000 0.4174613 0.450059 0.4032409

Weight algorithm converged in 10 iterations.

 Total Effects (column on row)
<0 x 0 matrix>

 Direct Effects
<0 x 0 matrix>

 Indirect Effects
<0 x 0 matrix>

 Inner model squared multiple correlations (R2)
 visual textual   speed
      0       0       0

 Inner model (composite) residual covariance matrix
<0 x 0 matrix>

 Outer model (indicator) residual covariance matrix
           x1          x2         x3         x4         x5         x6           x7        x8        x9
x1 0.59943401  0.53821206 0.61910818 0.11473134 0.05278178 0.13633379 -0.027837523 0.1161719 0.2669108
x2 0.53821206  0.48324288 0.55587684 0.24748588 0.19288654 0.26598479  0.101806987 0.2410096 0.3621323
x3 0.61910818  0.55587684 0.63942808 0.32621467 0.26370287 0.34723616  0.009335276 0.1610452 0.3124602
x4 0.32705111  0.14917604 0.13006763 0.81232650 0.81807926 0.80728176  0.130107846 0.1293709 0.2143993
x5 0.39212931  0.20658448 0.19581075 0.81807926 0.82387277 0.81299880  0.138153278 0.1379674 0.2227990
x6 0.30270509  0.12821376 0.10621252 0.80728176 0.81299880 0.80226835  0.128504702 0.1277103 0.2122997
x7 0.36400676  0.20002830 0.33786745 0.18214614 0.17631204 0.18181012  0.598910899 0.6456770 0.5785091
x8 0.24624719  0.08439455 0.21326888 0.20726547 0.20105298 0.20683553  0.645676971 0.6960948 0.6236820
x9 0.05780685 -0.07057904 0.02291509 0.08721782 0.08095414 0.08744424  0.578509057 0.6236820 0.5588022

 Residual-based fit indices
                                  Value
Communality                   0.6682645
Redundancy                    0.0000000
SMC                                 NaN
RMS outer residual covariance 0.3821996
RMS inner residual covariance       NaN
SRMR                          0.3418497
SRMR (Henseler)               0.2067663

 Absolute goodness of fit: NaN

 Composite Reliability indices # CR值
   visual   textual     speed
0.8011490 0.9287099 0.8288176

 Average Variance Extracted indices # AVE值
   visual   textual     speed
0.5740350 0.8128225 0.6179360

 AVE - largest squared correlation
   visual   textual     speed
0.4738310 0.7126186 0.5392400

 Heterotrait-monotrait matrix
           visual   textual     speed
visual  0.0000000 0.0000000 0.0000000
textual 0.4243230 0.0000000 0.0000000
speed   0.4235419 0.2895679 0.0000000
本文使用了R语言中的semTools和matrixpls包计算了AVE和CR值,大家一般使用semTools已经足够,操作相对简洁。
本文来自zhihu,观点不代表一起大数据-技术文章心得立场,如若转载,请注明出处:https://zhuanlan.zhihu.com/p/40018624
注意:本文归作者所有,未经作者允许,不得转载

