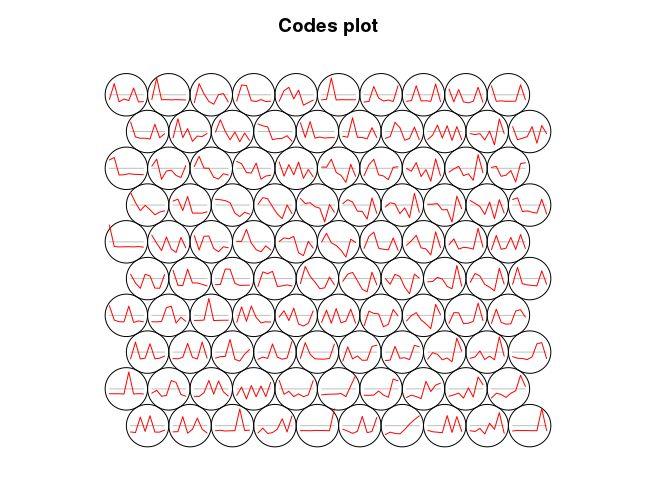
Even though SOM is similar to K-means, there is a fundamental difference. Centroids used in SOM have a predetermined topographic ordering relationship. During the training process, SOM uses each data point to update the closest centroid and centroids that are nearby in the topographic ordering. In this way, SOM produces an ordered set of centroids for any given data set. In other words, the centroids that are close to each other in the SOM grid are more closely related to each other than to the centroids that are farther away. Because of this constraint, the centroids of a two-dimensional SOM can be viewed as lying on a two-dimensional surface that tries to fit the n-dimensional data as well as possible. The SOM centroids can also be thought of as the result of a nonlinear regression with respect to the data points. At a high level, clustering using the SOM technique consists of the steps described in Algorithm below:
1: Initialize the centroids.
2: repeat
3: Select the next object.
4: Determine the closest centroid to the object.
5: Update this centroid and the centroids that are close, i.e., in a specified neighborhood.
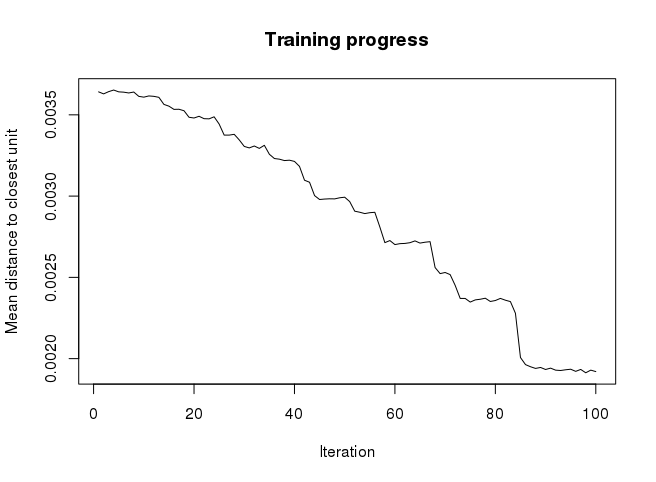
6: until The centroids don‘t change much or a threshold is exceeded.
7: Assign each object to its closest centroid and return the centroids and clusters.
SOM分析实战
下面是R中用kohonen包进行基因表达数据的SOM分析。
加载或安装包
### LOAD LIBRARIES – install with:
#install.packages(c(“kohonen”)
library(kohonen)
读入数据并进行标准化
data <- read.table(“ehbio_trans.Count_matrix.xls”, row.names=1, header=T, sep=“t”)