Hitesh Tripathi
Marketing mix modelling (MMM) or Media mix modelling is an analytical approach which used statistical techniques to quantify the impact of various marketing tactics (Market Mix) to optimise and forecast promotional tactics with respect to sales revenue or profit.
“Art is a lie that helps you understand the truth. Models are abstractions that help you understand reality.” — Pablo Picasso
The above word cloud is a representative of a marketing world when empowering with the potential of statistics with modern computational power it becomes a lethal weapon for an organization to make huge profits (on Y-O-Y basis).
Introduction:
Marketing Mix Modelling is a decision-making tool that marketing professionals can leverage to figure out an optimal spend allocation. It is the process of quantifying the impact of each marketing vehicle in terms of ROI and effectiveness.
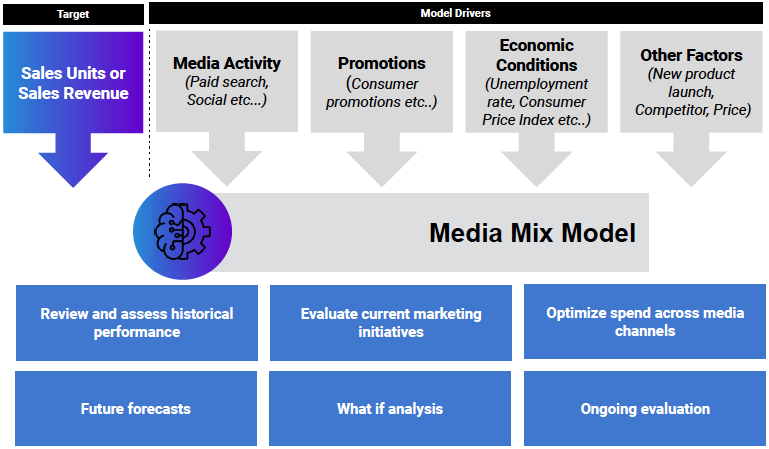
In MMM, the volume of sales is modelled as the dependent variable, while the independent variables represent elements (drives marketing) of the marketing process which are described below.
Objectives of MMM:
Evaluates past marketing performance (i.e, at least 2–5 years of historical data which is at least 5 years of monthly data or at least 2 years of weekly data) to measure how media channels drive sales to determine “true” marketing ROI and optimal mix of media activity:
- What is the Right mix of spend allocation that drives the highest ROI?
- Simulate sales in future from investment spent on the Market mix and alternate media plan.
- Identifying key drivers of sales (including marketing channels, price, competition, weather and macro-economic factors)
- How will channels perform in the future based on their optimized spend allocation?
- Build a user-friendly simulation and optimization tool.
- What media investment is needed for a say, 30% YoY revenue increase?
What is Data Granularity?
Data granularity is the level of detail considered in a model or decision making process or represented in an analysis report. The greater the granularity, the deeper the level of insights. Data granularity can help you drill down on the details of each marketing channel and assess its efficacy, efficiency and overall ROI.
Let us take MMM in Pharmaceutical industry, knowing which marketing channels work for each brand segment or even HCP(Healthcare professional) is far more informative than knowing what’s working for the company as a whole. Increased granularity can help you examine each brand’s performance and make specific, targeted adjustments to discrete variables to improve sales and profitability. Rather than using a shotgun marketing approach, increasing data granularity allows you to focus your marketing with laser-scope precision.
Key inputs affecting variable transformation:
The image below is a representation of variables of Market conditions, Marketing Actions, Competitive activities and many other variables impacting Analytics engine which in further impact Business outcomes.

Impact of Marketing Variables & workings of Marketing Mix modelling:
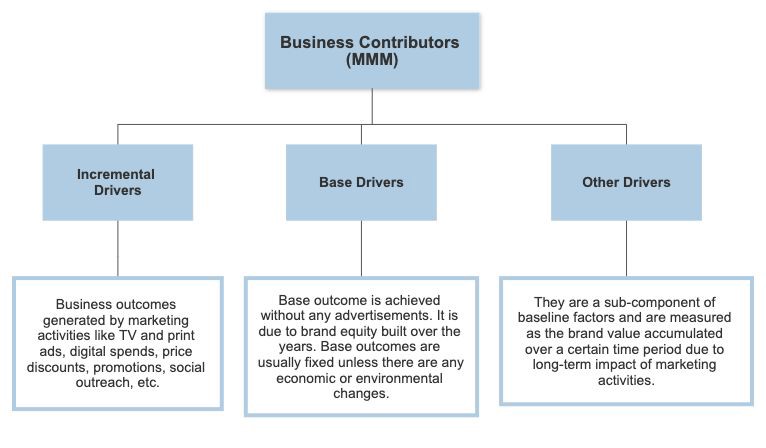
Marketing Mix modelling breaks down business metrics to differentiate between contributions from marketing and promotional activities (incremental drivers) vs. base vs. other drivers.
“The 4P’s was about “What does the marketer want to say?” while the 4C’s asks “What does the customer need to hear that the marketer can say?”
― Robert F. Lauterborn
These drivers can further be taken into account as independent variables on which in Marketing Mix modelling is done (by forming equation). Factors affecting the marketing mix can be defined as:


Understanding each of these variables is crucial for marketers to make an accurate forecast of the effects of promotional activities and product distribution. An analysis of Media mix model review and assess past performance, adjust according to current marketing scenarios, optimize spend across media channels future forecasts with What-if and Due-to charts are analyzed for evaluation.

1. Base Variables: The baseline is any impact achieved independent of marketing mix variables. They are influenced by various factors like brand value, seasonality and other non-marketing factors like GDP, growth rate, consumer sentiment, etc. Determining the baseline outcomes is critical to understand the impact marketing activities are having on a product’s performance and a product’s distribution.
2. Incremental Variables/Marketing contributors: Incremental variables are the component of sales driven by marketing and promotional activities. This component can be further decomposed into sales due to each marketing component like Television advertising or Radio advertising, Print Advertising (magazines, newspapers etc.), Coupons, Direct Mail, Internet, Feature or Display Promotions and Temporary Price Reductions. Some of these activities have short-term returns (Coupons, Promotions), while others have longer-term returns (TV, Radio, Magazine/Print).
3. Other variables:
Halo effect: Halo effect is a term for a consumer’s favouritism towards a product from a brand because of the positive experiences they have had with other products from the same brand. Halo effect can be seen as a measure of a brand’s strength and brand loyalty. For example, consumers favour Apple iPad tablets based on the positive experience they had with Apple iPhones.
Cannibalization: Cannibalization effect refers to the negative impact on a product from a brand because of the performance of other products from the same brand. This mostly occurs in cases when brands have multiple products in similar categories. For example, a consumer’s favouritism towards iPhone can cannibalize iPod sales.
Classification of marketing mix elements can be broadly classified under three categories:
This technique segments sales into the base and incremental components. Base component indicates long term consumer preferences. Incremental components indicate short-term variations due to promotions, temporary price changes, and above-the-line (ATL) and below-the-line (BTL) media activities.
This helps identify the best marketing channels to invest in, thereby creating effective media campaigns and setting better execution levels. Doing so also assists in running effective discount campaigns while avoiding base erosion, planning trade merchandising in modern retail, creating channel-level strategies, maintaining the right distribution levels, evaluating price elasticity from the competition, as well as evaluating and countering the impact of competitor’s promotions.


Building Modelling Dataset:
To determine the dimensions of data collected for the purpose of evaluation described below :


Performance of activities across the marketing mix (ROMI):
Return on marketing investment is one of the most difficult organizational aspects to measure. ROMI, a relatively new metric, is marketing contribution attributable to marketing (net of marketing spending), divided by the marketing “invested” or risked. ROMI is based on the calculation:
[Incremental Revenue Attributable to Marketing * Contribution Margin (%) — Marketing Spending] / Marketing Spending ($)
There are two forms of the ROMI metric: short-term ROMI and long-term ROMI. Short-term ROMI measures revenue such as market share, contribution margin or other desired outputs for every marketing dollar spent. This metric is best used to determine marketing effectiveness and steer investments from less productive to more productive activities.
Data Required for Marketing Mix Modelling:
To build a robust and accurate MMM model, we need data of different types. See the details below.
- Product data refers to the product and sub-product information along with price and no of units sold / unsold. It is required to understand various aspects related to the product – Whether it is a new product, which product category the product falls into? Is it the largest selling product? At what rate sales of this product is growing? What’s the price for each product in the category?
- Promotion data includes details about days when promotion or offers were active and the offer type like free delivery, cashback etc.
- Advertising data is used to measure how effective an advertisement is running. In TV Advertising, Gross Rating Point (GRP) is a method which measures total audience exposure to advertisement. You can also include other traditional methods such as Newspapers and Magazines and Radio.
- Seasonality: Increase in sales due to seasonality can make the calculation of identifying top drivers of sales biased. We would not be able to assess the impact of promotion on sales. For example, sales in woollen jackets will be higher in the winter season than summer. We also need to incorporate holidays and major events planned in a particular month. For example, sales during the Christmas season is generally higher than average sales.
- Demographics: factors such as age, race, and sex, refers to socio-economic information expressed statistically, also including employment, education, income, marriage rates, birth and death rates and more factors.
- Macroeconomic data: Sales can also be affected by macroeconomic factors like inflation, unemployment rate, GDP etc. Companies generally report a negative growth rate in sales during the recession. We need to incorporate these factors in our model so that it understands recession and cyclical effects.
- Sales: It is not possible to build MMM without sales variable. Sales can be in volume in units as well as revenue($)
Data Exploration:
- Importing Data: If you have data in CSV or Excel format, you need to load data into R/Python/SAS. After importing data, you need to ensure whole data have been loaded correctly by checking the number of rows and columns.
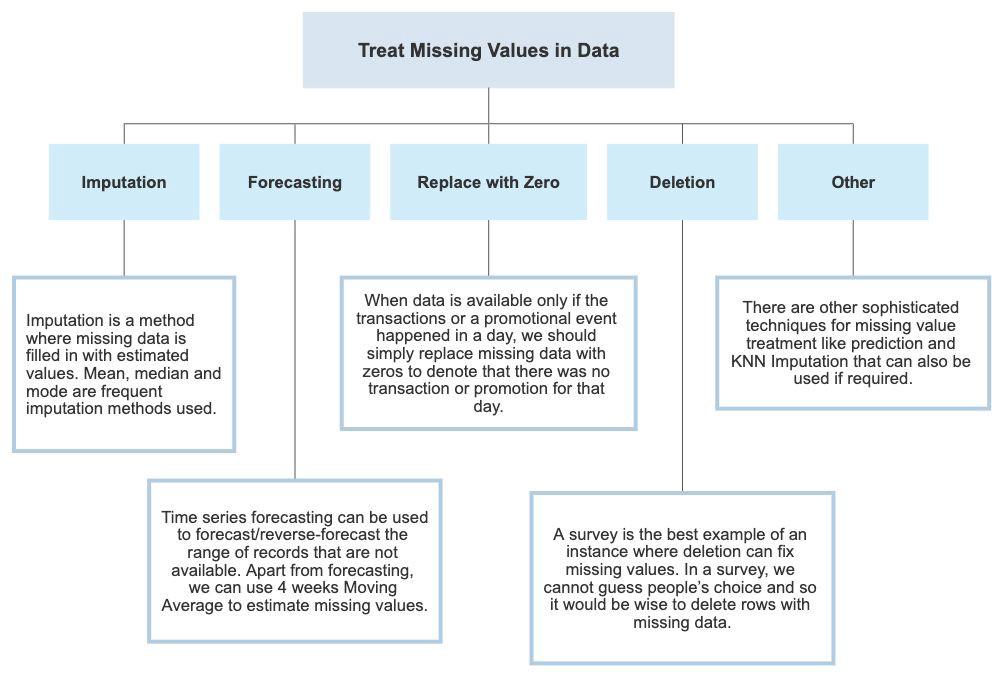
- Missing Values: A missing value is the non-availability of data for a particular observation or calculation in a variable. Usually, this happens because of errors during recording data or because of non-availability of data. Missing values may lead to biased variables, which in turn, may affect business outcomes.

3. Outlier values are referred to as extreme values (in plain English). One of the key objectives of MMM is to try and explain the spikes, otherwise known as outliers. Outliers may or may not occur at random.
The reason for an outlier could be seasonality, a new product launch, campaign, promotion, discounts, competitor actions, etc. It could also be due to randomness.
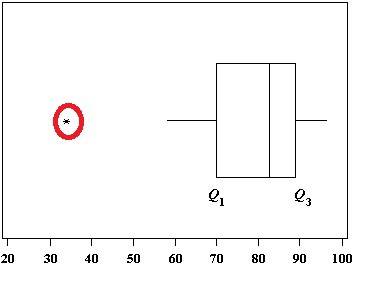

4. Univariate and Bivariate analysis are ways to perform exploratory data analysis(EDA). Univariate analysis refers to examine the distribution of a single variable. It can be done by calculating mean, median, mode, standard deviation and percentiles, visualised using Frequency distribution tables, Bar charts, Histograms, Pie charts and Line charts.
Bivariate analysis refers to checking the association between two variables. For example, inspecting the relationship between TV GRPs and Sales. The bivariate analysis helps to:
- Identify the key variables that exhibit a good relationship with the dependent variable
- Identify the type of relationship that the variable exhibits with the dependent variable
Types of bivariate analysis:
- Numerical and numerical variables: Relationship between two numerical variables could be visualized using scatter plots and line charts.
- Numerical and categorical variables: Relationship between numerical and categorical variables could be visualized using line charts or combination charts.
- Categorical and categorical variables: Relationship between categorical and categorical variables can be visualized using a stacked column chart and combination chart.
Non-Linear Marketing Data Transformations :
Volatility captures in advertising by applying the following, non-linear transformations to the marketing activities as shown below:
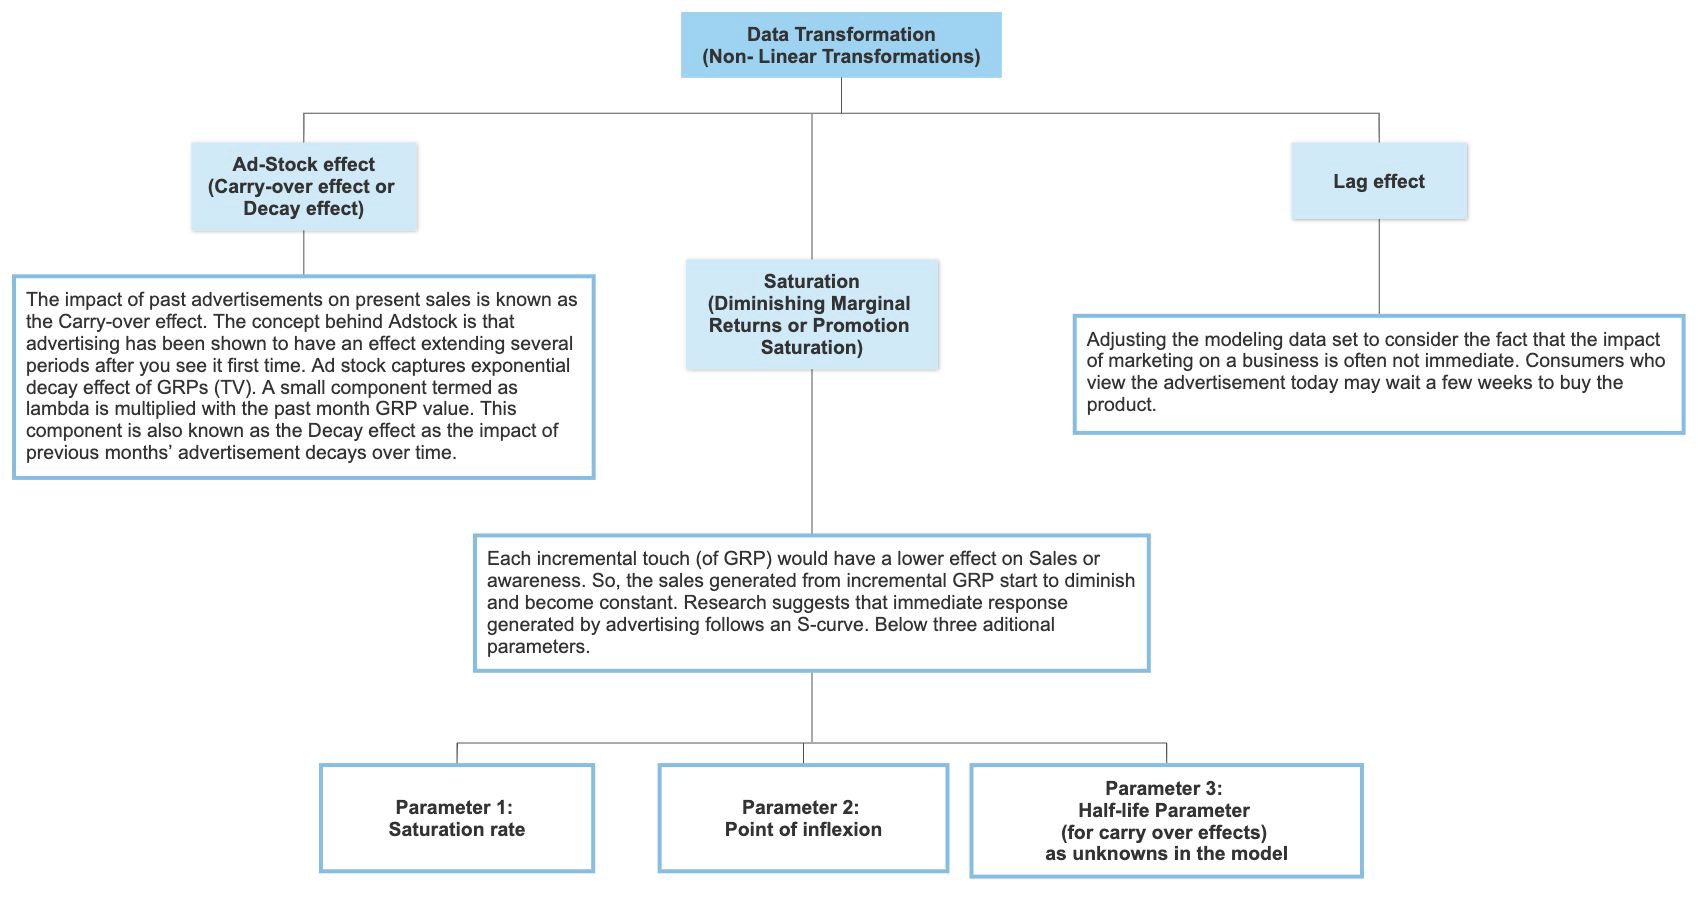

The transformation, in essence, represents the response curve. Certain variables don’t have a linear relationship with sales.
Data Transformations for non-linear(Most popular concepts):
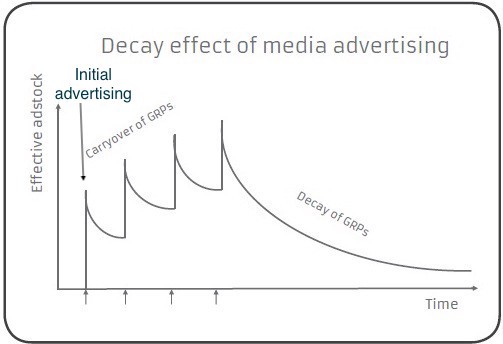
- Ad-stock effect/advertising carry-over: Decay effect on Media promotions is the effect of media promotions gradually fades from the minds of the audience. Therefore, in any given period of observation, the effect of a media channel is the sum of the effect of ongoing promotion and the un-faded/un-decayed part of all the promotions conducted in past.


where:
λ is the decay/lag weight parameter,
Adstock(t–1) is the carryover of advertising (product or media campaign etc.)
GRPt is the value of marketing variable at time t


2. Diminishing marginal returns or Saturation effect: The relationship between media adstock and sales impact is not linear. Incremental advertising in media supports impact sales with diminishing returns. A logistic function can map the media impact on sales. Media campaigns won’t result in incremental sales despite high media GRPs, as it reaches saturation.


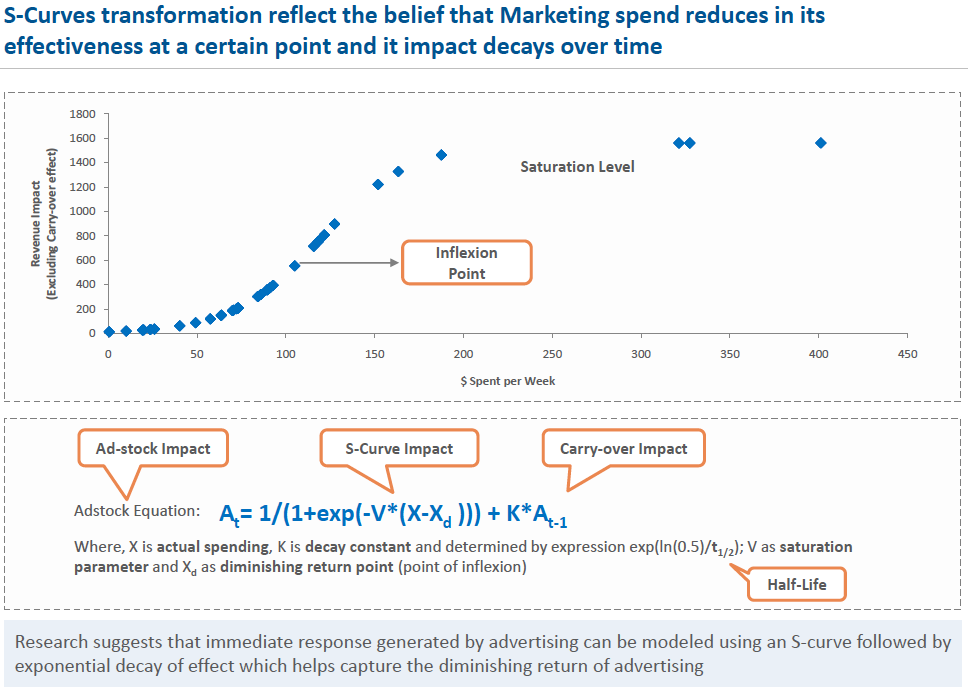

Significance of Sigmoid (S-Curve) transformations:


Advertising activities will have a non-linear impact on the KPI’s (Key performance indicator – is a measurable value that shows the progress of a company’s business goals) and they exhibit a pattern of diminishing returns. This impact tends to diminish as the spends reach a point of saturation post which there will be minimal impact. This entire impact can be captured in form of S-curve transformations.
The interaction effect between each of promotion: Empirically, it is found that advertising & promotion not only affect the brand shares but also exert interaction effects.
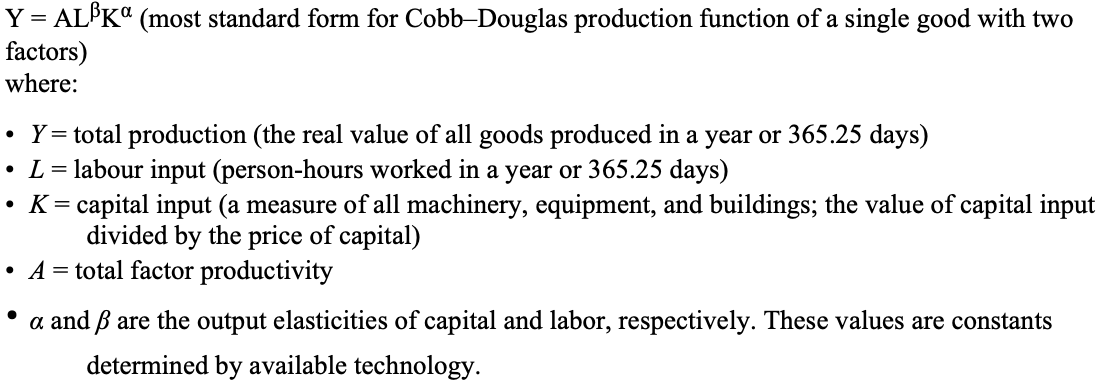
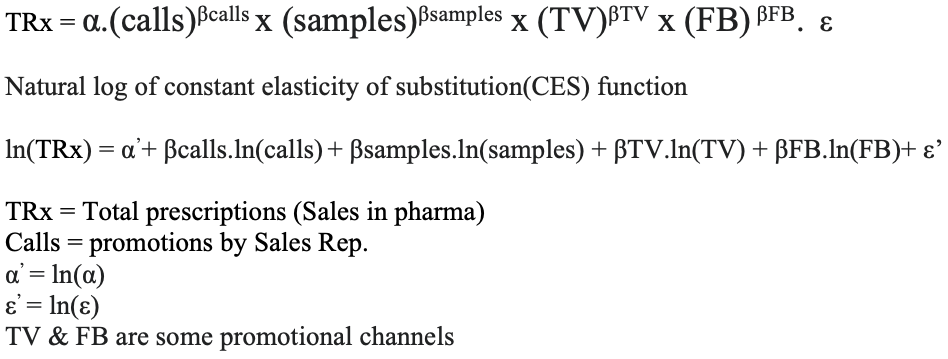
The linear equation does not capture the diminishing marginal returns also it is very difficult to take care of interaction effect between all the promotions, so here for multiplicative inputs Cobb–Douglas production function comes into the picture.
Cobb–Douglas production function :
The Cobb–Douglas production function is a particular functional form of the production function, widely used to represent the relationship between the amounts of two or more inputs (particularly physical capital and labour) and the amount of output that can be produced by those inputs.


Marketing Mix Modelling techniques :
Marketing Mix Modelling uses multiple linear regression, which attempts to find a mathematical relationship between a dependent variable (such as sales or engagements) and two or more independent variables (such as ad spend across channels).
Multiple linear regression assumes that there is a linear relationship between these variables as business problems consist of complex variables, and therefore that they can fit in a linear equation but it is not restricted to that, it can use both linear and non-linear regression methods. Here comes the concept of mix modelling, Multi-linear regression combines with Time-series Analysis to forecast the right mix of spend allocation that drives the highest ROI(Return on Investment).
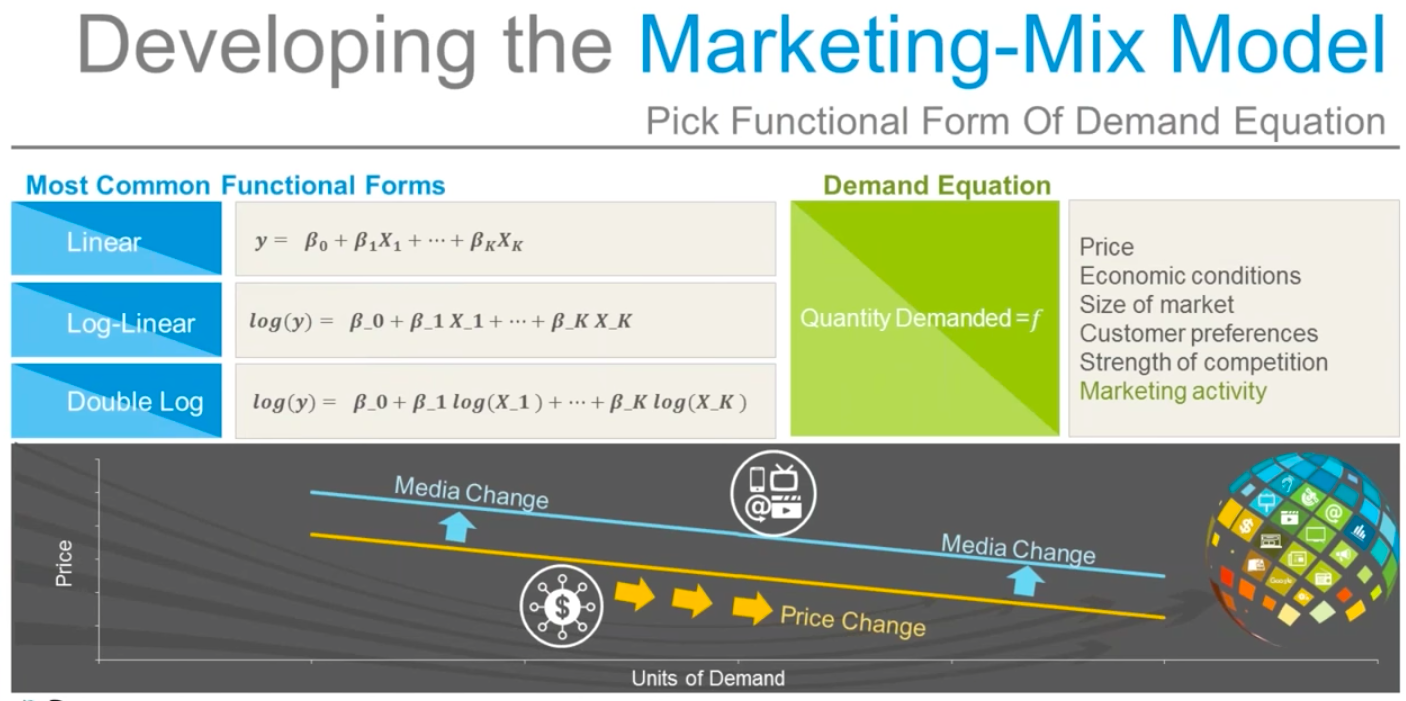
Mathematical models of MMM (Linear data/model):
There are a number of underlying assumptions about the dependent and independent variables, and their relationship, which affects the statistical procedures such as LSE and significance tests used for linear regression. These assumptions, listed here, need to be tested at the different stages of the regression process.
Normality: Variables and their combination are assumed to follow the normal distribution.
Linearity is assumed, as is evident from the name (multiple linear regression).
Homoscedasticity: Variance of dependent variable should not vary across the range of predictor variables.
Residuals (errors, i.e., predicted minus observed values) are assumed to be independent. The prediction errors should be uncorrelated, otherwise, it suggests some unexplained, systematic relationship in the dependent variable.


Model Performance indicators:


If you found this article interesting and contributed to your learning, give it a few claps or better still share it with your friends or colleagues.
You can find me on LinkedIn: https://www.linkedin.com/in/hiteshtripathi/
References: This article would not be possible without these below knowledge mines of MMM.
- Word cloud prepared: https://www.wordclouds.com/
- Hierarchy diagrams draw: https://cloud.smartdraw.com/
- https://www.latentview.com/blog/marketing-mix-modelling/
- https://www.marketingevolution.com/marketing-essentials/media-mix-modeling
- https://medium.com/@haiqunwa/marketing-mix-modeling-what-marketers-need-to-know-d9b65ca41c19
- https://www.latentview.com/marketing-mix-modeling/
- https://www.marketingevolution.com/marketing-essentials/media-mix-modeling
- https://blog.clairvoyantsoft.com/market-mix-modeling-mmm-introduction-methodology-and-use-case-dc5ae68820f8
- https://www2.slideshare.net/CPCStrategy-ConvertRetailIntent/leveraging-media-mix-modeling-to-drive-performance-marketing-results
- https://www.measurementmojo.com/blog/how-useful-is-your-data-the-importance-of-granularity
- https://www.exlservice.com/market-mix-modeling-for-retail
- https://www.ashokcharan.com/Marketing-Analytics/~st-regression.php
本文来自medium.com,观点不代表一起大数据-技术文章心得立场,如若转载,请注明出处:https://tripathitesh.medium.com/marketing-mix-modelling-mmm-a-potential-solution-48ba3a248de9
注意:本文归作者所有,未经作者允许,不得转载

