option = {
xAxis: {
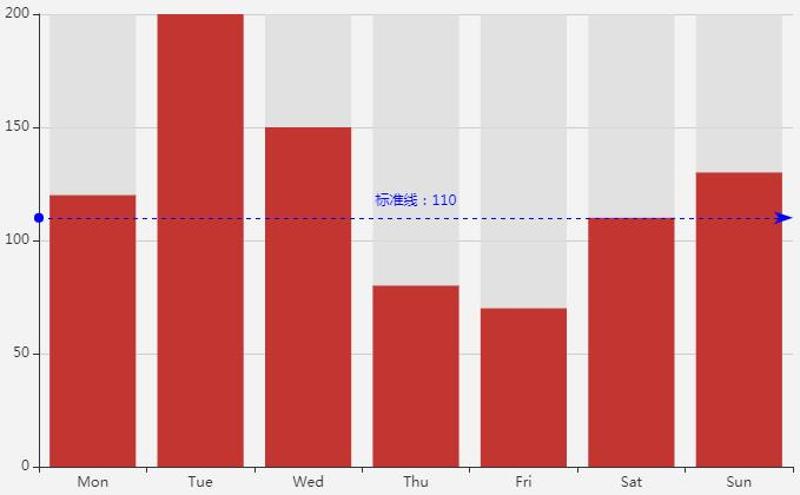
type: 'category',
data: ['Mon', 'Tue', 'Wed', 'Thu', 'Fri', 'Sat', 'Sun']
},
yAxis: {
type: 'value'
},
series: [{
data: [120, 200, 150, 80, 70, 110, 130],
type: 'bar',
showBackground: true,
backgroundStyle: {
color: 'rgba(220, 220, 220, 0.8)'
},
markLine: {
name: '标准线',
data: [{
yAxis: 110 //设置y轴起点
}],
label: {
position: 'middle', //设置文字显示位置可以是start,middle,end
formatter: '标准线:{c}',
distance: [10, 8]
},
lineStyle:{
color: 'blue'
}
}
}]
};
更多内容请访问:IT源点
注意:本文归作者所有,未经作者允许,不得转载