> library(“party”)导入数据包
> str(iris) 集中展示数据文件的结构
‘data.frame’: 150 obs. of 5 variables: 150条观测值,5个变量
$ Sepal.Length: num 5.1 4.9 4.7 4.6 5 5.4 4.6 5 4.4 4.9 …
$ Sepal.Width : num 3.5 3 3.2 3.1 3.6 3.9 3.4 3.4 2.9 3.1 …
$ Petal.Length: num 1.4 1.4 1.3 1.5 1.4 1.7 1.4 1.5 1.4 1.5 …
$ Petal.Width : num 0.2 0.2 0.2 0.2 0.2 0.4 0.3 0.2 0.2 0.1 …
$ Species : Factor w/ 3 levels “setosa”,”versicolor”,..: 1 1 1 1 1 1 1 1 1 1 …
Call function ctree to build a decision tree. The first parameter is a formula, which defines a target variable and a list of independent variables.
> iris_ctree <- ctree(Species ~ Sepal.Length + Sepal.Width + Petal.Length + Petal.Width, data=iris)
> print(iris_ctree)
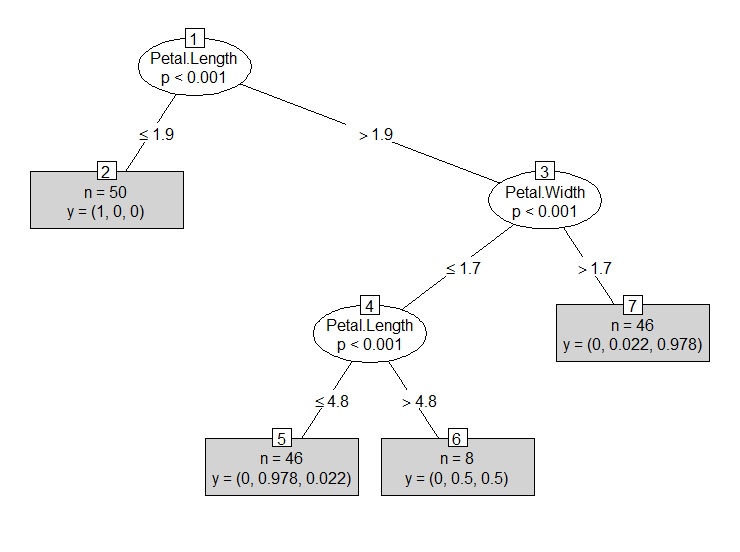
Conditional inference tree with 4 terminal nodes
Response: Species
Inputs: Sepal.Length, Sepal.Width, Petal.Length, Petal.Width
Number of observations: 150
1) Petal.Length <= 1.9; criterion = 1, statistic = 140.264
2)* weights = 50
1) Petal.Length > 1.9
3) Petal.Width <= 1.7; criterion = 1, statistic = 67.894
4) Petal.Length <= 4.8; criterion = 0.999, statistic = 13.865
5)* weights = 46
4) Petal.Length > 4.8
6)* weights = 8
3) Petal.Width > 1.7
7)* weights = 46
> plot(iris_ctree)

plot(iris_ctree, type=”simple”)
原创文章,作者:xsmile,如若转载,请注明出处:http://www.17bigdata.com/r%e8%af%ad%e8%a8%80%e5%ad%a6%e4%b9%a0%e7%ac%94%e8%ae%b0%e4%b9%8bdecision-trees/
更多内容请访问:IT源点
注意:本文归作者所有,未经作者允许,不得转载